Did you know countries are ranked each year based on a Happiness Index? This index rates the happiness of countries on a scale from 0 to 10, and it’s pretty fascinating! Today, I’m going to cover exactly what this supposed Happiness Index is, how it is formulated and what you can learn from it!
What is the definition of the Happiness Index? It’s an indexation of happiness based on survey results, that was first used in the 2012 World Happiness Report. In the survey, the respondents were asked to rate their happiness on a scale from 0 to 10. The Happiness Index is calculated by averaging the survey results of the respondents.
This post is about all the details of this beautiful Happiness Index. So grab yourself a nice cup of coffee, and let’s dive into the world of happiness (data)!
Contents
Happiness Index Definition
Let’s start with the simple definition of the Happiness Index.
That’s probably what you Googled before you landed on this article, right?
The Happiness Index was first created by the Global Happiness Council, a group of independent academic happiness specialists. This group of people has released the World Happiness Report (WHR) every year since 2012.
The definition of the Happiness Index originates from the Bhutanese Gross National Happiness Index. In 1972, Bhutan started prioritizing happiness over other factors such as wealth, comfort and economic growth. They created an indexation for happiness based on multiple measurable factors, and have kept track of this index ever since.
This inspired the Happiness Happiness Council to devise their own definition of the Happiness Index, which was coined in the 2012 World Happiness Report.
The Happiness Index was defined as follows:
The Happiness Index is defined as the weighted (by sampling weights) rate of respondents reporting “Very happy” or “Quite happy” less the weighted rate of respondents reporting “Not very happy” or “Not at all happy,” plus 100. The index thus ranges from 0 to 200.
The World Happiness Report has steered away from this definition ever since. The word “Happiness Index” doesn’t even occur in the 2018 World Happiness Report at all.
The report now determines the same concept as that of a “Happiness ladder”. Whenever I use the term Happiness Index in this article, I’m also talking about this Happiness Ladder.
But what does it mean?
What does the Happiness Index mean in 2018?
The 2018 World Happiness Report defines the Happiness Index (or “Life ladder”) as follows:
Please imagine a ladder, with steps numbered from 0 at the bottom to 10 at the top. The top of the ladder represents the best possible life for you and the bottom of the ladder represents the worst possible life for you. On which step of the ladder would you say you personally feel you stand at this time?
This ladder is known as the Cantril Ladder. It’s used in a lot of studies as a simple way to ask people to rate their current satisfaction with life – or happiness. More than a million people worldwide have been asked this question, and the answers have been used to create the yearly Happiness Index.
The Happiness Index – or Life ladder – is simply calculated by averaging the answers to this Cantril Ladder to a single number.
It’s pretty much how I measure my own happiness, but then on a scale from 1 to 10.
The Gallup World Poll
The World Happiness Report sources its data from the Gallup World Poll.
Gallup – the organization behind this enormous poll – interviews approximately 1,000 residents per country each year. Gallup interviews these people in over 150 countries around the world. These people are randomly selected, as long as they are registered civilians of the country (non-institutionalized) and aged 15 and older. Each respondent in this happiness survey is asked the same questions in his or her own language to produce statistically comparable results.
This enormous amount of data is used by the Global Happiness Council – in combination with other data sources – to construct the World Happiness Report.
And that’s what this article is about.
Now that you know what the Happiness Index is, let’s dive into the results of these surveys!
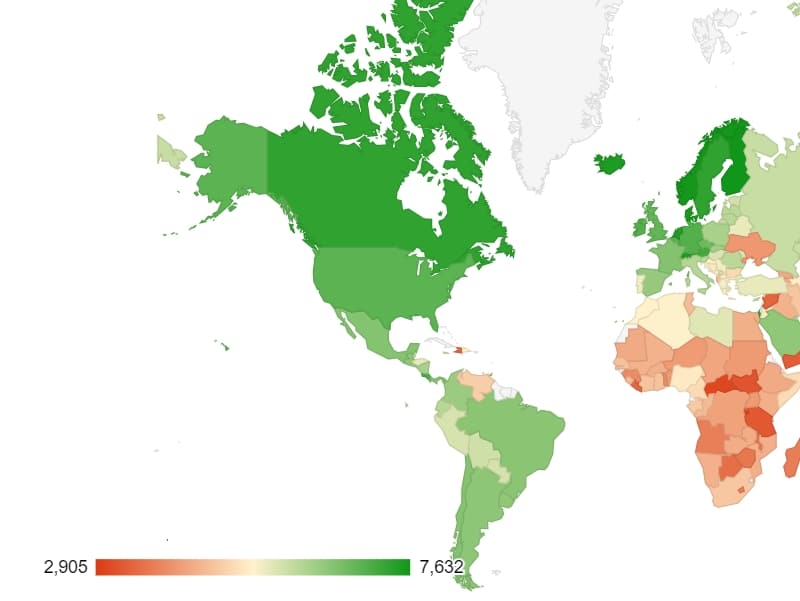
The happiest countries based on the Happiness Index
In 2018, the Gallup World Poll included Happiness Index data in 157 countries.
According to the Happiness Index of 2018, the happiest countries in the world are:
- Finland (7,63)
- Norway (7,59)
- Denmark (7.56)
- Iceland (7,50)
- Switzerland (7,49)
- Netherlands (7,44)
- Canada (7,33)
- New Zealand (7,32)
- Sweden (7,31)
- Australia (7,27)
On the other hand, the unhappiest countries in the world according to the Happiness Index of 2018 are:
- Burundi (2,91)
- Central African Republic (3,08)
- South Sudan (3,25)
- Tanzania (3,30)
- Yemen (3,36)
- Rwanda (3,41)
- Syria (3,46)
- Liberia (3,50)
- Haiti (3,58)
- Malawi (3,59)
The Happiness Index of all the surveyed counties is graphed below.
Have you found your country in this graph? Do you feel like this Happiness Index represents your own feeling of happiness?
For your information, the average Happiness Index of all the 157 countries is 5.38, which is lower than what I expected before writing this article.
In that sense, I feel VERY lucky and grateful for the fact that I was simply born in the Netherlands: a country that’s greatly positioned for happiness.
What factors are used to explain the Happiness Index?
This Happiness Index is already quite interesting, but as we know, a single number can’t explain the underlying principles that determine happiness.
That’s why the World Happiness Report goes further. The authors have found a number of key factors that could likely explain the variance in happiness.
This is important since these key factors allow us to learn from this happiness data, instead of just observing it.
This is also why we track our happiness factors in addition to the happiness factor here at Tracking Happiness. You need more variables than just a single number in order to learn from your data!
The key variables of the Happiness Index
The authors of the World Happiness Report have determined 7 key factors that are correlated most to the Happiness Index.
I want to show you how each country ranks for these factors while measuring how much they correlate to the actual Happiness Index.
GDP per capita
Gross Domestic Product – or GDP – is simply the value of all the goods and services a country produces on a yearly basis. This number is normally calculated by a national government statistical agency. Each country calculates GDP independently, which makes sense since a lot of classified information is required in calculating this number.
Divide the GDP by the total population of a country and you have the GDP per capita.
This is arguably the most accepted method of determining a country’s level of wealth. And as most of you know, a country’s wealth is highly correlated to its happiness.
Let’s first have a look at this GDP per capita per country.
Don’t be shocked by the color coding. There are a handful of outliers (which happen to be some of the smallest countries) that have a very high GDP per capita. This skews the color coding of this chart a lot!
What’s clear from this graph? Happy countries are generally also wealthy countries.
Now, you’re probably wondering how much do these factors correlate, right?
The wealth of a country is significantly correlated to its Happiness Index.
Money buys happiness up to a certain degree. I’ve analyzed all my personal finances and came to the same conclusion myself!
And this makes sense. Money enables development, growth, convenience and a lot of other things that could very well lead to a higher level of happiness.
An interesting outlier here is Costa Rica. Despite the relatively low GDP – compared to Western standards – the population still ranks very high on the Happiness Index! I’ve worked in Costa Rica myself on 2 occasions, and I can confirm: Costa Ricans all seem very happy. Sure, the country is troubled by crime, poor infrastructure and violence, but that apparently doesn’t stop the people from being happy.
Pura Vida! (you’ll know what this means if you’ve been there ;-))
Social support
The next key factor that is determined by the World Happiness Report is “Social support”.
Social support is defined by the same survey results of the Gallup World Poll data.
In the survey, the respondents were asked the following question:
“If you were in trouble, do you have relatives or friends you can count on to help you whenever you need them, or not?”
People were only able to answer with a yes or no. A yes would equal 1 and a no would equal 0. The average of all answers results in a single value that represents the amount of social support that is present in a country.
The chart below shows how each country scored on this “Social support” question.
Again, you can clearly see some trends in this dataset. Poorer countries are likely to score lower on the Social support question. This correlation is clearly visible in the scatter chart below.
Among the 157 surveyed countries, the Central African Republic has (by far) the lowest level of social support. This is easily explained by the continuous conflict the country has seen. Yet, the Happiness Index is not the lowest.
This indicates that the correlation between the Happiness Index and the level of Social support is not linear, but more exponential. The lack of Social support seems to affect the Happiness Index up to a certain level.
Healthy life expectancy
The estimate for the healthy life expectancy represents the average number of “healthy” years a child at birth is estimated to live. It’s calculated by the WHO based on over 100 different health factors.
Again, no surprises here. The correlation between a healthy life and a high Happiness Index is clearly visible.
Freedom to make life choices
Freedom to make life choices is another key factor in the Happiness Index.
Just as with Social support, this factor is determined based on the survey result of the Gallup World Poll. Applicants were asked this question:
“Are you satisfied or dissatisfied with your freedom to choose what you do with your life?”
The average of all answers determined the result of this factor per country.
Below chart shows how well this factor correlates to the Happiness Index.
One notable outlier here is Algeria, which manages to score relatively high on the Happiness Index despite a great lack of freedom. That said, it should be repeated that the sample size of the Gallup World Poll is “only” 1,000 per country on average. The poll doesn’t use a fixed percentage of the population for its target sample size.
Therefore, both the confidence level and margin of error of these results can fluctuate per country. This way, countries with big populations are more likely to be less accurate.
Generosity
Generosity was also determined by the Gallup World Poll survey results, by having respondents answer this question:
“Have you donated money to a charity in the past month?”
Again, the average of all responses (yes being 1 and no being 0) determines the output of this key factor.
Again, I’ve tested how much this key factor is correlated to the Happiness Index below.
There are two things that I want to highlight here:
- You are paradoxically happier when you focus on sharing your own happiness. This is such a valuable lesson, and the world would be a better place as a whole when more people would focus on sharing happiness.
- In my opinion, the definition of generosity is much broader than what the Gallup World Pool indicates. People don’t necessarily have to donate money to a charity in order to be generous. I think any good deed – whether that’s giving money or helping a random stranger on the street – is a sign of generosity.
Perceptions of corruption
“Perceptions of corruption” is also determined as a key factor in the Happiness Index. It is calculated by averaging the answers to the following 2 questions:
“Is corruption widespread throughout the government or not?”
“Is corruption widespread within businesses or not?”
Again, the average of all answers determines the outcome of this factor per country.
Personally, the key takeaway here is that the world is still a pretty corrupt place. More than half of the surveyed people worldwide answered that corruption is widespread.
This is the final key factor that has been determined in the World Happiness Report.
Luckily though, this factor has the smallest correlation to the Happiness Index. A lot of seemingly corrupt countries still maintain a high Happiness Index.
That’s the last of the key happiness factors that are determined in the World Happiness Report.
Well then, you might say that when you combine these happiness factors, you should be able to predict the Happiness Index for each country, right?
Wrong.
There’s a part of the Happiness Index that cannot be explained by these key happiness factors. And that’s the remaining “factor” that the World Happiness Report discusses.
Unexplained happiness
The WHR calculates how much of the Happiness Index can be explained by the key factors. Add them all up and you should get close to the actual number.
The map below shows how much of the Happiness Index cannot be explained by the key factors.
There’s not a lot we can learn from these numbers, besides the fact that happiness is a very difficult thing to measure and analyze.
In social studies, there’s always a big factor of uncertainty: Unlike other genres of science, the results simply can never be 100% explained. That’s because our daily feeling of happiness is dependent on an endless list of factors, most of which are emotional and/or unmeasurable.
We have to accept that there is a part of the Happiness Index that cannot be explained by other – more easily measurable – factors.
If this wasn’t the case, then my Happiness Prediction Model would have been much better at predicting my happiness!
Happiness Index by country
Here’s a stacked bar chart showing the Happiness Index per country again, only now including how much of this number can be explained by other factors.
Can you find your own country in this chart? Do you feel like your own perception of happiness matches that of the rest of your country? I’d love to hear your thoughts and comments about this in the comments!
💡 By the way: If you want to start feeling better and more productive, I’ve condensed the information of 100’s of our articles into a 10-step mental health cheat sheet here. 👇
This Cheat Sheet Will Help You Be Happier and More Productive
Thrive under stress and crush your goals with these 10 unique tips for your mental health.
Closing words
That concludes this brief introduction to the Happiness Index. I hope you now know what it is, how it’s measured and what you can learn from it. If you have any questions about anything, please let me know in the comments below, and I’ll be happy to answer you!

I wonder how WHR calculate the happiness score/index?
They average a thousand (sometimes more) questionnaire answers per country!
What is the most important factor among seven to explain the Happiness Index?
Hope to hear from your point of view
Why didn’t this article show the correlation between happiness and government spending as a percent of GDP. I think that correlation would be much higher than any of the correlations measured.
This article only focuses on the World Happiness Report, which doesn’t cover government spending. 😉