Over the last 5 years, I’ve tracked my happiness every single day. I’ve now used this data to build a happiness prediction model. That’s right. I’ve built a model that can accurately predict how happy I will be on a scale from 1 to 10, based on what I plan to do that day.
This model features over 80 happiness factors. Below is a sneak peek of these happiness factors. This shows how much certain factors – like running, my job and my relationship with my girlfriend – influence my happiness (but more on that later!)

I want to share with you exactly how I built this Happiness Prediction Model.
Be warned though, since this post will be quite technical at some points. It’s also one of the biggest essays I’ve ever written, with 9 animations, 2 interactive charts and a number of images. Oh, and let’s not forget the >4.000 words.
I also want to introduce my collaborator!
Alejandro – or Alex – Cencerrado is an expert at the Happiness Research Institute and a good friend of mine. We got in touch over our mutual passion for Tracking Happiness, and collaborated on the idea of building and presenting this Happiness Prediction Model. He’ll occasionally drop his expert commentary throughout this happiness essay.
If you have a question specifically aimed at him, you can contact him directly here.

What does this all mean?
This means that this happiness essay is going to be full of insightful and unique data. So grab yourself a coffee, and join me on this journey towards predicting happiness!
Contents
- My happiness ratings
- My normalized happiness ratings
- Introducing the happiness factors
- Assigning a value to the happiness factors
- Determining the likely influence of a happiness factor
- The Happiness Prediction Model
- Calibrating the Happiness Prediction Model
- The results of our calibrated Happiness Prediction Model
- How can I use this Happiness Prediction Model?
- How can I improve this happiness prediction model?
- Closing words
My happiness ratings
It all starts with the happiness ratings.
What’s a happiness rating? It’s a rating that I usually track at the end of every single day, and I use it to determine how happy I’ve been on a scale from 1 to 10. It’s the first step in my happiness tracking method.
Let me quickly show you what a single month of happiness ratings looks like!
Happiness ratings in February 2015
You can see all my daily happiness ratings for February 2015.
I specifically picked an interesting month with a big variance in happiness ratings. In February 2015, I was working as an engineer in Kuwait and it was quite a demanding and difficult period for me. That explains why my happiness looks all over the place.

The average happiness rating of this month was 6,66. Not too good, right?
It was a shitty month, with the absolutely low-point being the 9th in which I burned out and felt completely miserable.
I got on a plane back to the Netherlands on 21st and, luckily, my happiness ratings quickly improved.
My happiness ratings over the last 5 years
Now, I started tracking my happiness in December 2013.
That’s almost 5 years ago.
During this time, I’ve tracked a LOT of happiness ratings. 1,809 to be exact.
I am still tracking my happiness every day, but the cut-off point for this Happiness Essay was on the 13th of November 2018, when I compiled this data and started working on this essay.
Want to know what my complete set of happiness ratings looks like?
Here it is!

This animation might look a little intimidating at first, but it’s actually very simple.
It shows my daily happiness ratings, animated in chronological order. I’ve added a couple of comments in there, to provide some much-needed context.
For example, you can easily see how much my happiness was negatively influenced by my short period in Kuwait.
Anyway, these happiness ratings are just the first piece of the puzzle of building this Happiness Prediction Model.
Let’s continue!
My normalized happiness ratings
The next piece of the puzzle is to calculate the normalized happiness ratings. This makes it easier to analyze the data at hand and removes any redundant noise.
How does it work?
It’s pretty easy! The Normalized Happiness Rating (or NHR) is calculated by taking the daily happiness rating and subtracting the average happiness rating from this value.
Let’s go back to February 2015 for an easy example.
You might remember that my average happiness rating during that month was 6,66.
The normalized happiness rating is calculated by subtracting 6,66 from every daily happiness rating. So, on the 9th of February, I rated my happiness with a 3. It was a terrible day. If we subtract 6,66 from 3, we get an NHR of -3,66.
Now let’s take this one step further.
My cumulative normalized happiness rating in February 2015
We can take this NHR and accumulate it for the entire month.
Why?
Because this quickly shows us if my happiness was good or bad. Have a look at the Cumulative Normalized Happiness Rating (or CNHR) below.

I can explain this graph really easily:
If the line goes down, my happiness was below average. If the line goes up, my happiness was above average.
It doesn’t get much simpler than that, right?
Please note, that because we’re talking about normalization, this line will always end up at 0 (zero).
My CNHR’s over the last 5 years
Now let’s look at the Cumulative Normalized Happiness Rating of the last 5 years!

Again, this animation might look intimidating.
But it’s really easy to explain. If the line goes up, I was happier than average. If the line goes down, I was unhappier. It doesn’t really matter if the line is below or above zero, just worry about its slope for now.
This CNHR is calculated based on the total average happiness rating, which is 7,79. Over the last 5 years, I rated my happiness with a 7,79 on average.
I’ve also added the same colored comments as before, just so you can recognize some of the information I previously provided. Again, you can find all the context you need in my Happiness Journals!
I’ve just normalized 1,809 happiness ratings into CNHR’s, which I find much easier to interpret. I’ll use that for the next piece of the puzzle!
Enough about happiness ratings! It’s now time to introduce the happiness factors!
Introducing the happiness factors
So far, we’ve focused on the happiness ratings of the past 5 years. But that’s not all the data that I’ve tracked.
I’ve also kept track of what I call happiness factors: things that had a significant influence on my happiness.
What does this mean? That means that if I really enjoyed my work on a day, I’ll likely track “Work” as a positive happiness factor. If I had a big argument with my girlfriend, I’ll likely track “Relationship” as a negative happiness factor.
What do these happiness factors look like?
You can see what factors I tracked during February 2015 in the table below!
| Date | Happiness rating | Positive factors | Negative factors |
|---|---|---|---|
| 01-02-2015 | 7 | Exercising, Work | – |
| 02-02-2015 | 6 | – | Tired, Boring |
| 03-02-2015 | 7 | Exercising | – |
| 04-02-2015 | 6 | – | – |
| 05-02-2015 | 6 | – | Bored |
| 06-02-2015 | 7 | Traveling | Bored |
| 07-02-2015 | 6 | – | Work, Tired |
| 08-02-2015 | 5 | – | Work, Tired |
| 09-02-2015 | 3 | – | Work, Tired |
| 10-02-2015 | 7 | Exercising | – |
| 11-02-2015 | 6.8 | Exercising | – |
| 12-02-2015 | 7.5 | Relaxing | – |
| 13-02-2015 | 7 | Relaxing | Sick |
| 14-02-2015 | 7 | Exercising | – |
| 15-02-2015 | 6.75 | Relaxing | – |
| 16-02-2015 | 5 | – | Work, Headache |
| 17-02-2015 | 6.5 | Work | Relationship |
| 18-02-2015 | 6.75 | Relationship | – |
| 19-02-2015 | 7.5 | Work | – |
| 20-02-2015 | 5.75 | Relaxing | Sick, Headache |
| 21-02-2015 | 7 | Work | – |
| 22-02-2015 | 8 | Family, Relationship | – |
| 23-02-2015 | 7 | – | Work |
| 24-02-2015 | 7.25 | Running | Work |
| 25-02-2015 | 7.5 | Relationship | Work |
| 26-02-2015 | 7.5 | Soccer | Work |
| 27-02-2015 | 7.75 | Relationship | Work |
| 28-02-2015 | 8 | Soccer, Relationship | – |
Let’s look at the 9th of February again, which happened to be one of my worst days ever.
On this day, my happiness was significantly influenced by my work, and by being tired. These had a major negative impact on my happiness, so I recorded those things as negative happiness factors.
This is all pretty simple, right?
Assigning a value to the happiness factors
The next step in our puzzle is to assign a value to these happiness factors.
Let’s use the 9th of February again, as our example.
My average happiness rating over the entire dataset of 5 years is 7.79. On the 9th of February, I rated my happiness with a 3.
Therefore, my normalized happiness rating on that day is -4,79 (3 – 7.79).
We can use this normalized happiness rating to assign a value to the happiness factors.
Think of it like this:
What made me this unhappy on that day? Work and being tired. So it’s safe to assume that these factors each resulted in a normalized happiness rating of -4.79.
If we equally divide this NHR over the two recorded happiness factors, each factor will have an effective NHR of -2.395.
And that’s how I can assign a value to the happiness factors!
This calculation method has a couple of caveats:
- It doesn’t look at if a factor is positive or negative. If, for example, you have an NHR of +1.50 on a day, with 2 positive happiness factors (running, relationship) and 1 negative happiness factor (tired), then they will each have an assigned value of +0.50. This will obviously result in a lower accuracy in the model.
- This calculation cannot assign a value to happiness factors if the happiness rating is equal to the overall average. This will result in an NHR of 0.00, which leaves no value to divide over the factors!
These things can (and will) be improved in a new iteration of this model. Let’s worry about that later, and continue working on what we have.
With that out of the way, we can now loop through the entire dataset (that’s still 1,809 days of happiness ratings and factors). We can calculate the assigned happiness “value” for each happiness factor for each day.
This will result in a LOT of extra data.
Allow me to explain:
In the past 5 years, I have tracked 87 unique happiness factors. Each of these factors will be assigned a daily value (0.00 if it wasn’t tracked that day). That will result in 87 x 1,809 = 157,383 cells of data.
What I can do next, is I can calculate and visualize how much a happiness factor has influenced my happiness over the last 5 years.
I accumulated all the daily values and animated the result in the chart below. This animation shows how the happiness factor “Work” has influenced my happiness over the last 5 years. This is based only on the calculation method I explained before.

I want to point out a couple of things here:
- If I didn’t track “Work” as a happiness factor, then the line will remain flat. It also remains flat when the happiness rating on a day happened to match the overall average. In these cases, it’s impossible to assign a value to the happiness factor.
- When the line goes down, it means I tracked a lot of days in that period where my happiness rating was below average and my work had a significant impact – whether positive or negative.
- It works the other way around as well. When the line goes up, it means that my happiness was above average, and my work significantly influenced it (again, whether positive or negative).
Can you see that huge drop that starts in February 2015?
Yes, that’s exactly how much I hated working in Kuwait. It was a very difficult time, and it’s good to see how this sentiment is supported by the animation.
Anyway, this is something I can calculate for all factors!
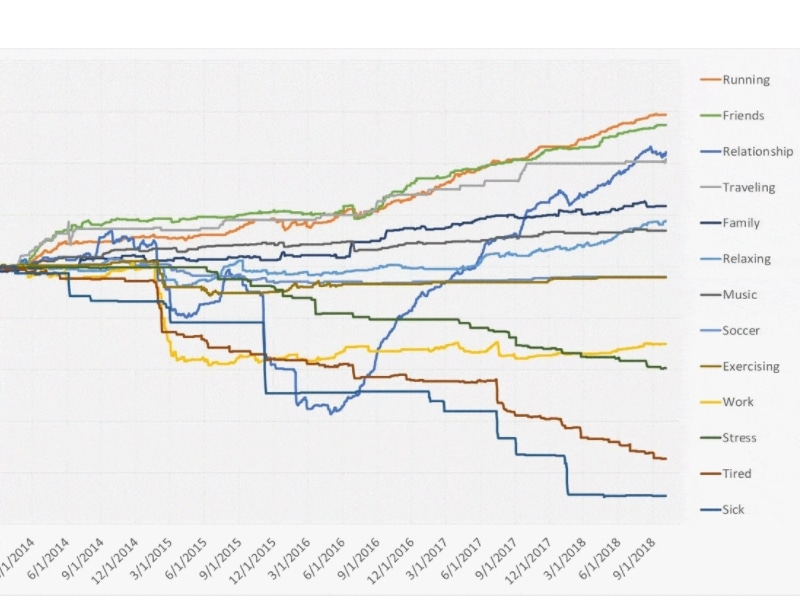
The animation below shows the cumulative value of the top 13 most occurring happiness factors.
Let’s see what Alex has to say about this visualization, before continuing.
I think this is a super interesting way of visualizing how happy you were when each of the factors appeared in your happiness journal.
Social connection is the most important factor for your happiness (friends, family, relationships, perhaps even work…). This is in line with what we see in all our projects at the Happiness Research Institute.
As Christopher Johnson said a few days before he died in his solo travel diary: “Happiness is only real when shared”.
I also want to point out some interesting things within this animation again:
- You can still see the steep drop that my “Work” experienced in February 2015.
- In that same period, my relationship was also taking a hit since my girlfriend and I were in a challenging long-distance relationship. My relationship was also beaten-up quite badly at the end of 2015, during our worst long-distance period. This LDR almost ended our relationship, and it crushed my happiness (you can see this in the 5-year CNHR animation).
- You can clearly see how often I’ve been sick during these 5 years. And each time, it’s resulted in a significantly affected happiness.
- Running, Friends, Traveling and my Relationship had the biggest positive impact on my happiness, according to this calculation method.
I already find this data VERY interesting, but I want more…
This essay is about engineering a Happiness Prediction Model!
Let’s continue with the next piece of the puzzle!
Determining the likely influence of a happiness factor
You might have seen it coming, but the next step is to determine the most likely effect that a happiness factor has on my happiness.
What does this mean?
Let’s take my work as an example again. The animation above shows that the cumulative value of this happiness factor over the last 5 years was -16.692.
This value was created over 416 days. For the rest of the days, my work did not have a significant effect on my happiness.
With this data, it is very easy to calculate the most likely effect that my work will have on my happiness the next time it is influenced by it.
I simply divide -16,692 by 416 and find out that – on average – my work has resulted in a -0,0482 change in happiness. That is a negative influence!
So whenever work has had a significant influence on my happiness, it has generally resulted in a decreased happiness rating by 0,0482 points.
I can calculate this expected effect of all happiness factors.
In fact, here is a table showing the expected influence of the most occurring happiness factors:
| Happiness Factor | Count | Mean Effect Of Happiness Factor |
|---|---|---|
| Relationship | 831 | 0.0300 |
| Running | 416 | 0.0748 |
| Work | 346 | -0.0482 |
| Relaxing | 328 | 0.0275 |
| Friends | 265 | 0.1068 |
| Family | 216 | 0.0573 |
| Tired | 208 | -0.1793 |
| Music | 137 | 0.0513 |
| Traveling | 118 | 0.0187 |
| Exercising | 115 | -0.0183 |
| Sick | 75 | -0.6028 |
| Stress | 75 | -0.2650 |
| Soccer | 73 | -0.0275 |
With this table, I can build my happiness prediction model.
The Happiness Prediction Model
It works really simple.
Let’s say I have a busy day coming up next Friday, in which I will go to work, visit my family, compete in a running race, and spent the rest of the day with my girlfriend.
It’s safe to assume that my happiness will likely be influenced by these factors: Work, Family, Running, and Relationship.
These factors respectively have the following expected influence on my happiness: -0.048, +0.0573, +0.0748, and +0.0300.
I can now calculate my expected happiness rating by adding all these values to the mean happiness rating.
So the mean happiness rating over the last 5-year period is still 7.79.
My predicted happiness rating is calculated as follows: 7.79 – 0.048 + 0.0573 + .0748 + 0.0300 = 7.9041.
Makes sense, right?
I can calculate this predicted happiness rating for every day during the last 5 years. This is called hindcasting. I’m predicting what my happiness should have been over these 5 years, based on the data that I have.
And that’s how I can test the accuracy of my Happiness Prediction Model.
Let’s see how this Happiness Prediction Model compares to my actual happiness ratings, based on October 2018 (I purposely picked the most recent full month here).

You can see how the model is quite good at matching the trend of my happiness ratings. But I’ll go ahead and say it: I think I can do better!
Before discussing our next move, let’s see how the current model hindcasts the entire 5 years of data. This interactive graph allows you to see the predicted happiness rating of every single day.
(It’s pretty wide, so you might want to scroll from the left to the right!)
So, as I said, this model seems to follow the trend of my happiness: it generally goes up when it should, and it goes down when it should too.
But it needs a little tweaking, still.
For example, have a look at the worst days in this dataset. You’ll that the predicted happiness ratings never match the extreme lows of my actual happiness ratings. Sure, they go down a little as well, but not as far as they need.
In fact, the lowest predicted happiness rating in this dataset is just a 6.38, which was predicted for the 4th of September 2017. On this day, my happiness was influenced by 3 negative happiness factors: Sick, Stress, and Pain. My actual happiness rating on that day was a 3.
It was one of the most painful days of my life.
My Happiness Prediction Model apparently doesn’t yet recognize just how much these negative happiness factors suck.
But that’s something we can fix!
Here’s another animation of a scatter chart which shows the problem more clearly.
The x-axis shows my actual happiness rating, while the y-axis shows the predicted happiness rating by this model. Every blue dot on this graph represents a single day.

This is where I need to get a little more technical.
You can clearly see that there is a correlation between my prediction and the actual happiness ratings. That’s great.
For you statisticians, the Pearson correlation coefficient for this data is 0.612. The coefficient of determination (or R2) is 0.374.
Your model is quite accurately estimating your happiness. This is always surprising when dealing with subjective data: you’re trying to make sense of something that looks immeasurable at first sight.
As you said, the coefficient of determination (R^2) is 0.374, which means that you can explain 37% of the variance in your predicted happiness based on the happiness factors.
That’s very high in social science! We get similar numbers in the studies we perform! For example, if we get an R^2 of 0.5 we know we’ve asked the right questions.
This tells me that we’re onto something. This current iteration of the model is able to estimate happiness ratings quite well. It could be much better though, as we saw with the 4th of September 2017!
And for that, I’m going to have to calibrate this model.
Calibrating the Happiness Prediction Model
If you look at the previous animation, you can see the orange line, right?
This line represents that of a perfect correlation of 1. For example, if dataset A is perfectly correlated to dataset B (with a correlation of 1), then all the data points on the scatter will follow this straight line.
I’m actually pretty bad at explaining a perfect correlation myself, so let me link to this much better explanation of what correlations are.
I want the trend line of my Happiness Prediction Model to follow this theoretically perfect correlation.
We can actually get there by modulating – or calibrating – the model.
Modulation
Let’s go back to the previous animation. You can see that the formula of the trend line of our total dataset equals (y =) 0.1989 x + 6.2453.
This is important.
It means that (on average) the predicted happiness rating (or y) can be calculated by multiplying the actual happiness rating (x in this case) by 0.1989 and then add 6.2453.
Remember that a perfectly correlated dataset should result in the following equation (y =) 1 x.
So my current model should be modulated in such a way that the effect of the happiness factors is amplified. And I can calculate what this amplification should be because I know the formula of our current model’s trend line.
I can calculate this “amplification factor” by dividing 1 by 0.1989. This results in a factor of 5.03.
Here’s what this “amplification” looks like on the effect of my most occurring happiness factors.
| Factor | Count | Avg. Effect | Mod. | Mod. Effect |
|---|---|---|---|---|
| Relationship | 831 | 0.0300 | x 5.03 | 0.1508 |
| Running | 416 | 0.0748 | x 5.03 | 0.3764 |
| Work | 346 | -0.0482 | x 5.03 | -0.2427 |
| Relaxing | 328 | 0.0275 | x 5.03 | 0.1383 |
| Friends | 265 | 0.1068 | x 5.03 | 0.5373 |
| Family | 216 | 0.0573 | x 5.03 | 0.2881 |
| Tired | 208 | -0.1793 | x 5.03 | -0.9017 |
| Music | 137 | 0.0513 | x 5.03 | 0.2579 |
| Traveling | 118 | 0.0187 | x 5.03 | 0.9418 |
| Exercising | 115 | -0.0183 | x 5.03 | -0.0919 |
| Sick | 75 | -0.6028 | x 5.03 | -3.0323 |
| Stress | 75 | -0.2650 | x 5.03 | -1.3332 |
| Soccer | 73 | -0.0275 | x 5.03 | -0.1381 |
This is how I’ve calibrated my prediction model. After this calibration, the predicted happiness ratings should theoretically match the orange line more closely.
Let’s have a look, then, shall we?
The results of our calibrated Happiness Prediction Model
So after calibrating our model, here are the results of what we’ve been working on! This is the same scatter chart as before.

Pretty awesome right?
The trend line now accurately matches the orange reference line, with the theoretically perfect formula of (y=) 1 x.
The trendline of our calibrated model has a formula of (y=) 1.0003 x + 0.0118. This is as close as it gets.
So what have we done here? Well, the accuracy of the model itself has been tweaked a little.
Both the Pearson correlation coefficient and the coefficient of determination (or R2) have remained the same, at respectively 0.612 and 0.374.
So the model still works exactly the same. The weight factor of the happiness factors has just been amplified in order to more closely match the actual happiness ratings.
This should result in the model more accurately predicting the happiness factors, especially for the (very) unhappy days.
Here is the total set of data that I collected over the last 5 years.
Again, this interactive chart is quite wide, so you might need to scroll around a bit. 😉
See how this model more accurately follows the actual happiness ratings?
I think this is a really interesting result.
It’s still FAR from perfect, obviously. If you find the 9th of September 2017, you’ll see that the calibrated model predicts a happiness rating of 0.69. This doesn’t even fit my happiness scale!
In addition, the maximum predicted happiness rating now exceeds 10, which also exceeds my scale!
This is, again, something we can finetune. But I want to leave that to the next Happiness Essay, in which I’ll further develop this Happiness Prediction Model.
How can I use this Happiness Prediction Model?
Now you must be wondering: what’s the use of this model?
And honestly, I don’t really know.
Despite the fact that it’s insane that we’re able to – somewhat accurately – predict happiness based on just data, I can not yet think of an actionable use of this model.
Maybe, somewhere in the future, this model can be linked to our calendars?
Think about it:
We fill our calendars with stuff we need to do: deadlines, doctor’s appointments, family visits, nights out.
These are all things that could influence our happiness. You see where this is going, right? These things are happiness factors! And maybe they’re already in our prediction model!
Our model could theoretically read that calendar and provide an estimated happiness forecast based on your input.
So if you have a day coming up in which you have to finish a deadline at work and visit the family-in-law right after, our model could theoretically read you a warning message:
ALERT: [Visiting Family-in-law] and [working overtime on this deadline] will likely result in a [DECREASE] of [1.25] on your happiness rating!
Here’s an example of this million-dollar idea. ?

Obviously, I’m joking with this idea here. It’s not like I will start living my life based on what my model tells me to do. I need to accept it for what it is: a fun experiment.
Maybe, if the idea of Tracking Happiness grows into something much bigger, this model can result in something actually useful.
Either way, this Happiness Prediction Model could – and should – be improved a LOT.
Because there are simply a lot of errors still there. And that brings me to the final chapter of this Happiness Essay.
How can I improve this happiness prediction model?
Sure, the model is reasonably accurate already, but there’s still room for improvement.
If you’ve just finished your cup of coffee – the one that you started drinking at the start of this post! – then you might still remember the following improvements:
1. Separate the effect of positive and negative happiness factors
There are happiness factors that can have both a positive and a negative effect on my happiness ratings. Examples are:
- Work
- Relationship
- Weather
- etc
The model currently doesn’t separate these positive and negative factors, which results in a damping effect. It’s simple, as a lot of positives and negatives are combined into a single value, which might as well end up being zero!
This might also explain why I needed to amplify the effects of my happiness factors when calibrating the model!
As you said, you will be able to explain much more variance in your happiness when you split every factor depending on whether it was positive or negative. I am sure you will be able to explain around 60% of your variance in happiness when you make the right improvements.
But what happens with the unexplained remainder of your happiness? Well, you will probably never be able to explain all of it. In social science, there is always a given amount of variance that we cannot explain, purely because the topic is so subjective.
When studying happiness, we have to accept this uncertainty, but it does not limit us to draw important conclusions from the data. In fact, your coefficients – or happiness factors – are clearly pointing you in the right direction to increase your happiness: more sport, better social connection, less sleep deprivation.
Now it’s time to use this knowledge, by making small but incremental changes in your life. Then see if your average happiness rating grows over time. That’s how the science of happiness works!
This is exactly the kind of feedback that I value. After having tracked my happiness for 5 years, it’s clear that there are uncertainties in the data. But despite these biases, inaccuracies, and doubts, it’s important to realize that the value you track is valuable regardless of how accurate it is!
Anyway, for the sake of this Happiness Essay, I want to explore more ways to improve the accuracy of this Happiness Prediction Model!
2. Make the model based on a trailing 365-day period
Right now, the model calculates the effect of happiness factors by looking at the entire data set of 5-years. Also, the Normalized Happiness Rating is calculated based on the average happiness rating of these 5 years.
I think the model could be more accurate if I calculated these values based on a trailing 365-day period instead.
It makes sense, right? Happiness factors change over time. What was once a positive happiness factor could slowly transform into a negative factor. My relationship is clear proof of this, and the same goes for my work.
This would require a lot of extra computations, but I’m convinced the accuracy will be much improved by doing this!
3. Include other data besides happiness factors
Right now, this model works purely based on the input of happiness factors.
But there are other factors that are not directly tracked in my happiness factors that could still influence my happiness!
Here’s a couple of examples:
- The seasons (I might have be happier by default during Summer?)
- Special days, like my birthday, Christmas or anniversaries?
- The amount of traffic on my commute
- The number of calories I consume
I’m not saying these are all practical factors that could be included. No way am I going to include calory consumption in this Happiness Prediction Model!
But other factors like these might serve as an improvement. We’ll have to see if they do when I find the time to upgrade this model!
Closing words
As you can see, there are plenty of things that can be improved. This Happiness Essay will definitely be followed up, as it was just too much fun to work on.
With that said, I want to wrap this up.
What do you think of this Happiness Prediction Model? Are you just as excited by all this data analysis as I am? Do you have any questions about what I did here?
If you have any questions about anything, please let me know in the comments below, and I’ll be happy to answer!
Cheers!

Hugo, it would be interesting to try to find a more nuanced way of tracking work. I believe certain kinds of work have an enormous positive effect on happiness, while others obviously have a big negative effect. Malcolm Gladwell, in his book Outliers, identifies 3 primary factors necessary to make work satisfying: (1) autonomy, (2) complexity, and (3) a connection between effort and reward. Perhaps if you started tracking whether those are present, you could separate positive-happiness work from negative-happiness work. My guess is that in Kuwait you felt a lack of autonomy and perhaps little to no connection between the amount of effort you were making and potential rewards?
Hey Jeoff, thanks again for your interesting thoughts. This would probably increase the quality of my analysis, but would triple the amount of mental effort required as well. It’s hard to track these 3 factors every day, opposed to just determining a happiness rating.
But you hit the nail on the head: in Kuwait, I felt like I was working my ass off for something that I didn’t really care about. And my work was influencing a huge part of my life, so that snowball quickly got bigger.
Hi Hugo,
I’ve been working on an app that I think you would find extremely interested. It is essentially a happiness tracking program that is very much similar to your tracking methods. We should get in touch soon!
Shoot me an email
Hope to hear from you soon!
Emailed! 🙂
This is fascinating, thorough, and well thought-out. Thanks for sharing. A couple thoughts:
– Be careful about fine-tuning your model too much to track well against past data. You’re testing it against the same data you used to create the model. This can cause your model not to adapt well to new circumstances. In these types of scenarios, often a dataset is split, by random selection, into two segments: one for building the model, one for testing it.
– The damping effect caused by your method of calculating the influence of each factor on your HR could possibly be improved by isolating each effect, if you have enough data for this. For instance, find days where only a single factor is listed. Or find days where only positive or only negative factors are listed, and split it between them. This would also let you test, then, against days with multiple factors of different signs to see if this method really does lead to accurate predictions.
– If you want to get really fancy—and you danced around this point at the end, using only the last 365 days—instead of calculating a single number for the effect of a factor, calculate a regression for the effect of the factor; for a linear regression, it would be y=mx+b, where x would be the date and y would be the factor’s effect in your HR. Or you could do an exponential regression (but don’t over-fit!). Either way, this would allow a factor’s effect to evolve over time.
Hi Lucas,
Thank you so much for your comment! I really appreciate you taking the time to give tips and feedback! 🙂
“In these types of scenarios, often a dataset is split, by random selection, into two segments: one for building the model, one for testing it.”
That makes total sense, yes. This would be a cool approach for the next iteration!
“For instance, find days where only a single factor is listed. Or find days where only positive or only negative factors are listed, and split it between them.”
Again, this should be a very good method for increasing its accuracy!
I really like your recommendations, and am pretty excited to see how they effect the model!
Thanks for stopping by, hope to see you around here more often! 😉