The World Happiness Report has just been released. Again, Finland has been crowned the happiest country, for the 7th year in a row.
But this year, the researchers have focused on happiness levels across different age groups. Something that hasn’t been done at this scale before. So we dove headfirst into the data, and structured it all neatly in a big spreadsheet (available for you here).
We found that Mongolia, the Netherlands and the UK are best at spreading happiness equally amongst different age groups.
Finland might be the happiest country on earth again. On a scale from 1 to 10, the average Finn rates his/her happiness with 7.741.
But that happiness is not divided entirely equally. In fact, their younger population (those aged 30 or lower) are significantly less happy.
The data is divided into 4 age groups:
- <30 years old: happiness of 7.300
- 30-44 years: happiness of 7.688
- 45-60 years: happiness of 7.903
- >60 years old: happiness of 7.912
That’s a big difference! Even though Finland has made the news as the world’s happiest country, there are likely hundreds of thousands of young Finns who cannot relate.
When you focus only on the youngest age group, Finland only ranks 7th in terms of happiness:
- Lithuania: happiness of 7.759
- Israel: happiness of 7.667
- Serbia: happiness of 7.658
- Iceland: happiness of 7.598
- Denmark: happiness of 7.329
Interestingly enough, Lithuania has the happiest youth. On average, Lithuania is ranked 19th, but its population aged 30 years or younger is the happiest in the world.
Lithuania is a great example of a generational difference in happiness inside a country. Here’s what that looks like:
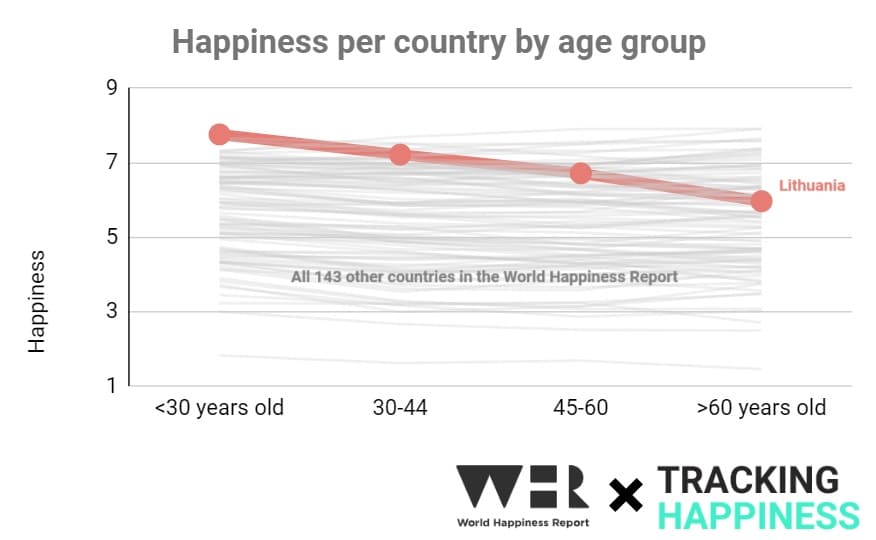
Equal happiness across age groups
Finland may be the overall happiest country on earth, but its happiness is not equally divided. The same goes for Lithuania. Even though their youth is the happiest, their older generations are far unhappier.
Some countries are much better at dividing happiness. In order to quantify this, we calculated the standard deviation of happiness between the 4 age groups per country.
A lower standard deviation means a higher equality of happiness between age groups.
These are the top 10 countries where happiness is most equally divided:
- Mongolia: Standard deviation of 0.04 (Nationwide happiness is 5.696)
- Netherlands: Standard deviation of 0.05 (Nationwide happiness is 7.319)
- United Kingdom: Standard deviation of 0.05 (Nationwide happiness is 6.749)
- Spain: Standard deviation of 0.06 (Nationwide happiness is 6.421)
- Belgium: Standard deviation of 0.06 (Nationwide happiness is 6.894)
- Singapore: Standard deviation of 0.08 (Nationwide happiness is 6.523)
- Switzerland: Standard deviation of 0.08 (Nationwide happiness is 7.060)
- Hong Kong: Standard deviation of 0.09 (Nationwide happiness is 5.316)
- France: Standard deviation of 0.10 (Nationwide happiness is 6.609)
- Malta: Standard deviation of 0.10 (Nationwide happiness is 6.346)
Even though Mongolia is ranked 77th on this year’s list, they are ranked 1st at dividing that happiness equally amongst age groups.
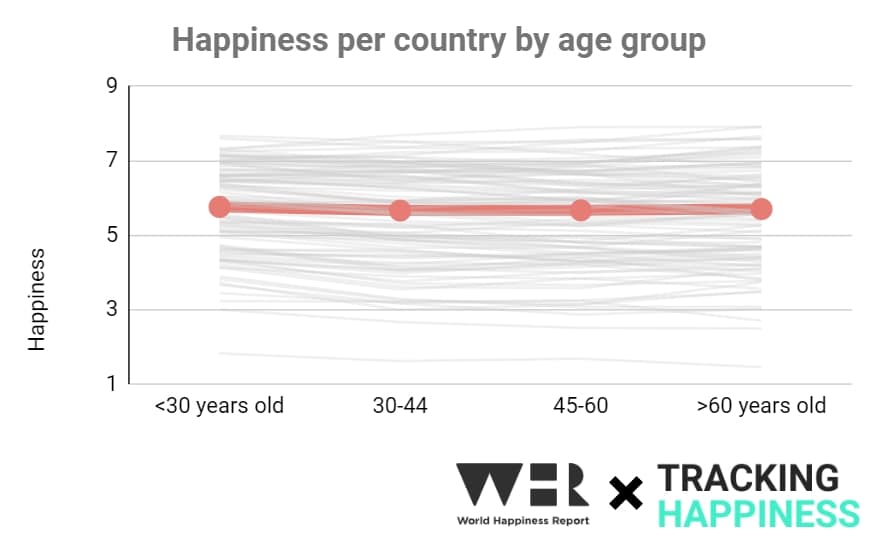
Mongolia’s place in this chart may not be the highest, they do have the flattest line (indicating the lowest standard deviation).
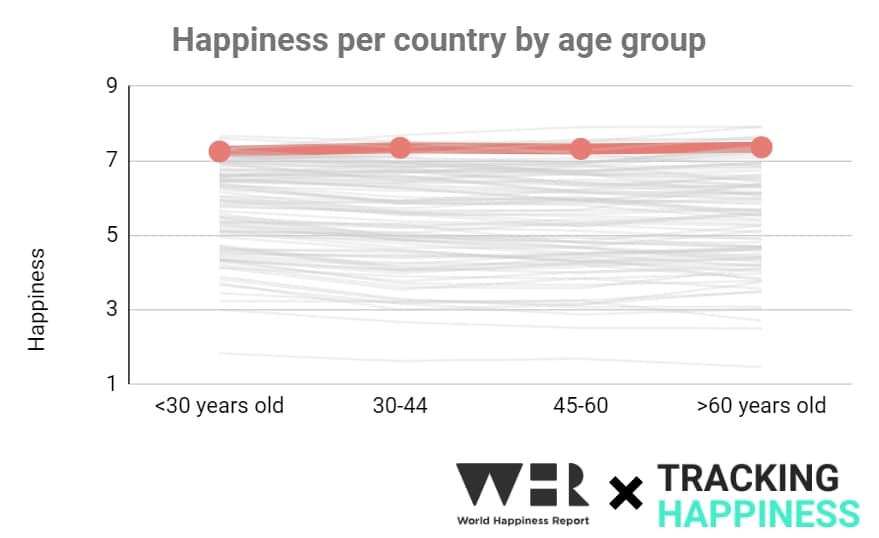
The Netherlands is 6th on the overall happiness charts, but they are 2nd when it comes to equally dividing that happiness among age groups.
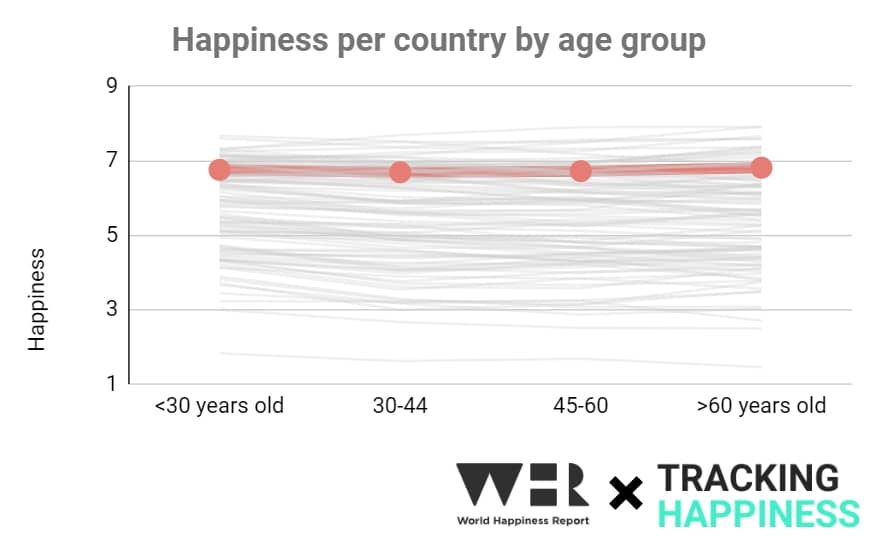
The United Kingdom does a great job of dividing their happiness too. They are ranked 20th on the overall charts, but they are ranked 3rd on our equal happiness charts.
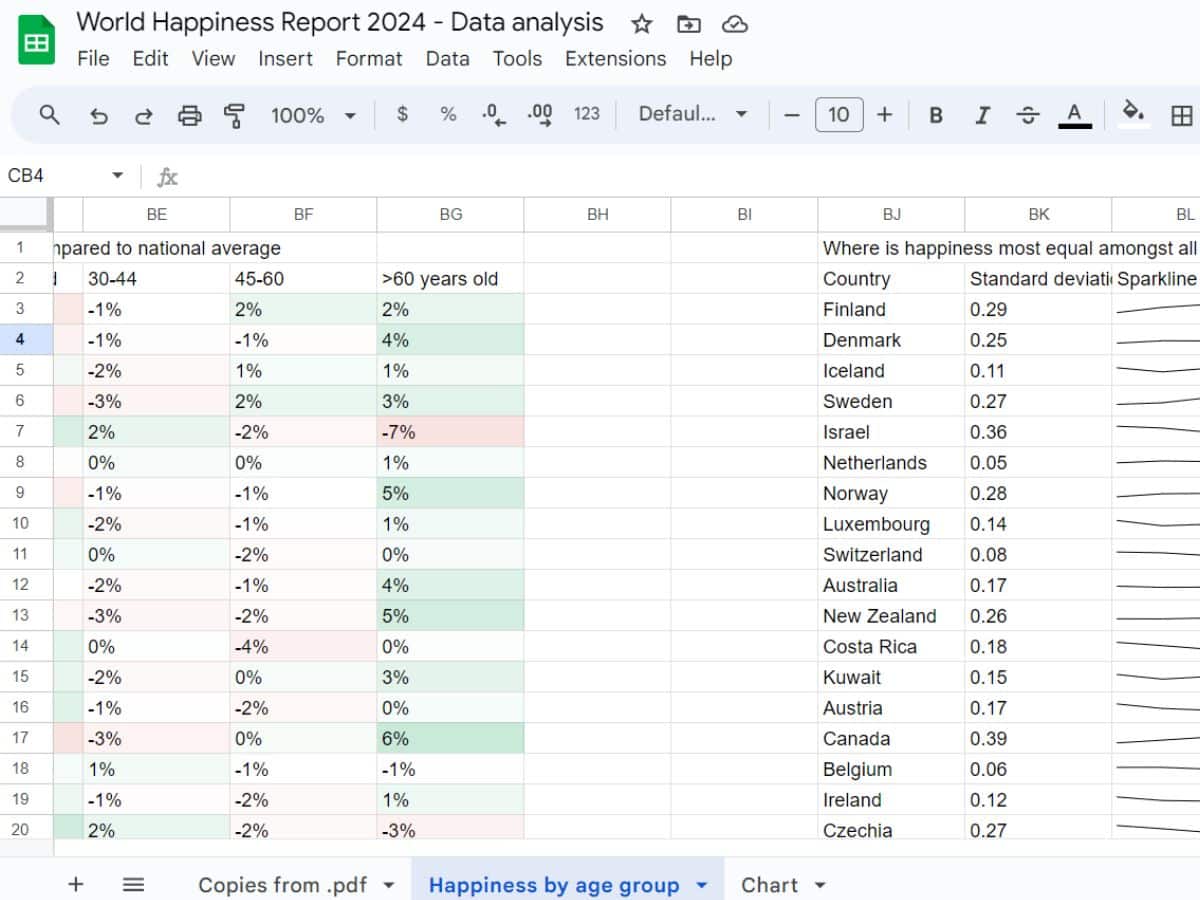
If you want to play around with this data, feel free to make a copy of this spreadsheet!
Unequally divided happiness
Here are the 10 countries where happiness is the least equally divided:
- North Macedonia: Standard deviation of 0.71 (Nationwide happiness is 5.369)
- Paraguay: Standard deviation of 0.74 (Nationwide happiness is 5.977)
- Ukraine: Standard deviation of 0.74 (Nationwide happiness is 4.873)
- Lithuania: Standard deviation of 0.76 (Nationwide happiness is 6.818)
- Bulgaria: Standard deviation of 0.77 (Nationwide happiness is 5.463)
- Moldova: Standard deviation of 0.78 (Nationwide happiness is 5.816)
- Montenegro: Standard deviation of 0.79 (Nationwide happiness is 5.707)
- Albania: Standard deviation of 0.79 (Nationwide happiness is 5.304)
- Croatia: Standard deviation of 0.82 (Nationwide happiness is 5.942)
- Serbia: Standard deviation of 0.85 (Nationwide happiness is 6.411)
What’s very interesting here is that the bottom 5 countries are all Balkan countries.
Let’s focus on Serbia. It’s ranked lowest in this list, meaning the country’s happiness is the least equally divided. Serbia is the 3rd happiest country if you only count people aged 30 or less. But the people aged 60 or older rank somewhere in the middle.
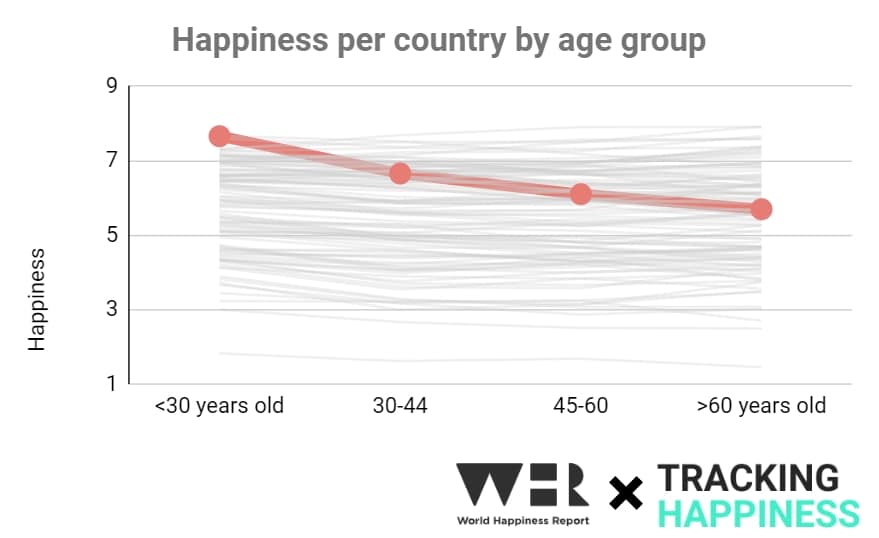
This pattern is apparent in all these Balkan countries: Serbia, Croatia, Albania, Montenegro, Moldova and Bulgaria. Older generations grow increasingly less happy, whereas the younger generations are disproportionally happy.
Risks of a generational divide in happiness
Throughout history, there have been several instances where younger generations have found themselves in conflict with older generations. These conflicts often arise from differing values, visions for the future, economic conditions, and general happiness.
A generational divide in happiness often creates tension. An unbalance of social and economic differences between large groups of people.
History has shown that this can lead to large movements. Here are some notable examples:
- The 1960s Counterculture Movement: In the United States and other parts of the world, the 1960s were marked by a significant cultural shift. Young people rebelled against the conservative norms of their parents’ generation, advocating for civil rights, peace, sexual freedom, and environmentalism. This era saw substantial clashes over music, politics, and lifestyle choices.
- Student Protests of 1989 in China: The Tiananmen Square protests were primarily led by students and young intellectuals calling for democratic reforms and greater personal freedoms, opposing a government that was seen as corrupt and resistant to change. The protests highlighted a significant generational divide in visions for China’s future.
- The May 1968 Protests in France: This is another example of youth rebellion, where students and young workers protested against traditional institutions, consumerism, American imperialism, and the conservative culture. The unrest represented a significant generational divide and led to widespread social changes.
- The Arab Spring: While not solely a conflict between younger and older generations, the Arab Spring was significantly fueled by the frustrations of younger people against older, entrenched political regimes. Young protestors sought political reform, economic opportunities, and more significant participation in the governance of their countries.
Closing words
As Mongolia, the Netherlands, and the UK demonstrate, balancing this joy across generations is both possible and essential. So even though Finland has been crowned the happiest country on earth for 7 years in a row, maybe we ought to look at Mongolia for inspiration?
If you want to analyze our data, feel free to take a look here. This spreadsheet is read-only, but you can create your own copy or download it to edit it as much as you like!
What are your thoughts? Do you have a question about something from our analysis? Leave a comment below to let us know.
Fair use and redistribution
Tracking Happiness grants you permission to reuse, host, or repost the graphics and images from this article. When doing so, we ask that you kindly attribute the authors by linking to Tracking Happiness or this page.

Commentary from the team:
Hugo Huijer, Founder of Tracking Happiness
Why is equal happiness amongst age groups important?
To support these claims, we’ve looked at the underlying data. We found that there was a small negative correlation between the standard deviation of happiness between age groups versus a country’s happiness. The R-squared between these datasets was found to be 0.007, meaning that the (un)equal distribution of happiness can explain 0.7% of a country’s happiness.
If you want to play around with this data, feel free to make a copy of this spreadsheet!