A couple of days ago, the World Happiness Report of 2020 was released. This report analyzed the impact of COVID-19 on the national happiness of countries. No significant change in happiness was found. The change from 2017-2019 to 2020 varied among countries, but not enough to change rankings in any significant fashion. The same countries remain at the top.
But how does happiness data compare to the varying lockdowns around the world? Does a country’s willingness to respond to COVID-19 correlate to a decrease in happiness? Countries have handled the pandemic in vastly different ways, and by analyzing this data, we’ve found a number of interesting observations. In the end, we want to answer the question:
How does a country’s happiness compare to its COVID-19 response?
Our observations:
- The 4 happiest countries in the world are less stringent than 88% of countries worldwide.
- The Netherlands, New Zealand and Austria are the only countries that score positively on relative stringency and are in the top 10 happiest countries.
- The world’s happiest country – Finland – is ranked 124th on the relative stringency scale, out of 138 countries.
- A lenient COVID-19 response may actually have a positive effect on a country’s happiness, which is supported by more studies.
- The top 10 happiest countries are less stringent than 75% of the world.
This study contains interactive charts with data so that you can see how each country in the world compares to the average.
Happiest countries in 2020
Every year, Gallup surveys at least 1,000 people in each country, with the following question:
Please imagine a ladder with steps numbered from zero at the bottom to 10 at the top. The top of the ladder represents the best possible life for you and the bottom of the ladder represents the worst possible life for you. On which step of the ladder would you say you personally feel you stand at this time?
The average of these questions is used as a country’s happiness score. The below map visualizes each country’s score of 2020.
Stringency index per country
Every country’s lockdown is different. Some countries are relatively pro-active and do everything in their power to stop the virus from spreading, like New Zealand. On the other hand, some countries are more lenient and accept the spread of the virus but try to do so in a controlled way.
While each country takes its own actions, there’s a team at Oxford university that considers all these actions and turns them into a composite metric: the Stringency Index. This number is updated every day, for every country around the world.
Simply explained, if a country has no COVID-19 response whatsoever, the stringency index will be 0. In this case, the government has done nothing to stop the virus from spreading.
If that country then decides to change course and takes every possible precaution, the stringency index will increase to 100.
For example, Argentina scored the maximum stringency points from March 23, 2020 to April 25, 2020. During this time, the country was in full lockdown.
Other countries whose stringency has scored the maximum points are Georgia, Honduras, India and El Salvador (there are more).
This interactive chart shows the daily stringency index per selected country.
(Click on this link if the chart does not function properly – opens in new tab)
Stringency index: how it works
More than 100 volunteer academics and students collate publicly-available information on government response measures, across nine policy areas. These are assigned stringency ratings which are then used to derive a composite score between 0 and 100.
The Oxford team is not currently collecting any sub-national data, meaning that the index does not perfectly capture local measures in large or federal countries. This explains why Italy never scored the maximum 100, even though their entire northern province entered a severe lockdown during the first outbreak.
A measure only in force in one or two regions contributes less to the stringency index than a nationwide policy.
Adding COVID-19 to the stringency data
Comparing national happiness levels to the stringency of a country is not revealing without comparing the stringency to the severity of the pandemic. After all, the response measures taken by countries are strongly correlated to the spread of the virus.
Most countries around the world use the number of reported new COVID-19 cases as a measure to determine a proper response. Therefore, we’ve included data from the John Hopkins University and added it to the stringency data.
This interactive chart shows the daily stringency scores of a selected country, in addition to the 7-day average number of positive COVID-19 cases.
(Click on this link if the chart does not function properly – opens in new tab)
This shows how a country reacts to the spread of the virus. Some countries are quick to adapt their rules, while others are “less willing” to respond quickly.
We use a rolling 7-day average because some countries do not report COVID-19 numbers seven days a week. For example, Sweden only reports the data from Tuesdays to Fridays. Any COVID-19 data from Saturday to Monday is logged on Tuesday, which skews the daily number of cases. A rolling 7-day average smoothens these inconsistencies.
Comparing stringency and COVID-19 data
The stringency of a country can be plotted against the COVID-19 cases in a scatter to show how the two compare. This shows a strong correlation between the ongoing spread of the virus and the response of a country.
The number of COVID-19 cases is first calculated on a per-capita basis. The population of the United States (~330 million) is roughly an order of magnitude larger than Canada’s (~40 million), which is roughly an order of magnitude larger than New Zealand’s (~5 million). In order to compare the virus spread between countries, we calculate the 7-day average number of positive COVID-19 cases per 1,000 people.
This interactive chart shows the comparison between the two sets of data. Please note that the number of cases per 1,000 people is charted on a logarithmic scale.
(Click on this link if the chart does not function properly – opens in new tab)
This type of chart reveals a lot about how a country responds.
For example, New Zealand’s stringency index reached a score of 96 before exceeding an average of 0.01 new COVID-19 cases per 1,000 people. On the other hand, Belarus tested an average of 0.2 COVID-19 cases per 1,000 people while only increasing its stringency score to a relatively low 28.
Worldwide average stringency
We set out to find how stringent each country is compared to the worldwide average.
The relation between stringency and the number of COVID-19 cases per 1,000 people is logarithmic in nature. Therefore, the worldwide average stringency can be modeled as a logarithmic function of the virus spread.
The resulting formula (based on the time-series available at the time of publishing) is shown below, where Y equals the modeled average stringency index and X equals the 7-day average number of new COVID-19 cases.
Y = 2.5178*LN(X) + 71.871This worldwide average stringency index is used to determine whether a country is stringent or lenient.
The interactive graph below shows the modeled average stringency index in addition to each country’s actual data.
(Click on this link if the chart does not function properly – opens in new tab)
This shows how the United States was relatively slow to react to the rising number of COVID-19 cases. Filter the chart for Libya and you’ll see an example of a more stringent response.
Some studies have already ranked countries depending on how stringent or lenient they are. However, these studies have not considered the number of positive cases per day. Without comparing a country’s stringency to the worldwide average for a given number of positive cases, the stringency data alone does not provide the full story.
Ultimately, we’re interested in a country’s total score. To find out, we calculated the daily difference between the actual stringency index and the modeled worldwide average. Finally, we determined a weighted average value based on the 7-day average number of new COVID-19 cases.
We use a weighted average because proper response measurements become increasingly more important as the virus spreads. The response of a country has significantly more implications when that country is seeing 10,000 new cases every day as opposed to 100 new cases every day. In other words, when the going gets tough, the stringency matters more.
This map visualizes all countries, showing the weighted average difference between a country’s stringency compared to the worldwide average.
Top 10 least stringent countries
The top 10 least stringent countries according to our method are:
- Belarus
- Nicaragua
- Burundi
- Burkina Faso
- Croatia
- Taiwan
- Estonia
- Bosnia and Herzegovina
- Niger
- Zambia
While these countries score poorly on the stringency index compared to other countries, it must be said that these countries haven’t been hit as hard as some others. For example, the maximum number of positive cases (7-day average) per 1,000 people in Nicaragua is only 0.02.
Countries that have been hit much harder and have scored below average on our relative stringency metric are:
| Country | Average Difference From Worldwide Stringency | Maximum number of positive cases (7-day average) per 1,000 people |
|---|---|---|
| Bulgaria | -18.44 | 0.57 |
| Switzerland | -13.54 | 1.24 |
| Serbia | -12.38 | 1.23 |
| France | -3.33 | 0.98 |
| Russia | -13.75 | 0.22 |
| Ukraine | -7.77 | 0.37 |
The bar chart below shows all countries ranked from top to bottom.
It must be stated that these numbers are only approximations. Here are some factors that this analysis doesn’t take into account:
- The limited testing capacity during the first wave of the pandemic resulted in a lower number of reported cases. Most countries were hit much harder than the data shows during the first wave.
- Countries use different metrics to determine a response strategy for COVID-19. For example, some countries use the availability of hospital beds rather than the number of reported cases as the main driver for decision making.
- Countries use different guidelines to report COVID-19 data, regardless of the available testing capacity. For example, China has changed its definition of what constitutes a positive test case 8 times in the past already.
- Speaking of China, this is also a good example of the implications of how stringency data is calculated on a national level. During the first wave, it’s well-known that the virus spread in the Wuhan province. This local area promptly went into lockdown. However, since the rest of the country remained mostly unaffected, the overall stringency index of China was lower.
How does this compare to national happiness levels?
This table shows the 10 happiest countries in the world, according to the 2020 World Happiness Report.
| Country | Happiness score | Average Difference From Worldwide Stringency |
|---|---|---|
| Finland | 7.842 | -14.95 |
| Denmark | 7.620 | -12.88 |
| Switzerland | 7.571 | -13.54 |
| Iceland | 7.554 | -19.18 |
| Netherlands | 7.464 | 0.64 |
| Norway | 7.392 | -4.84 |
| Sweden | 7.363 | -3.46 |
| Luxembourg | 7.324 | -9.60 |
| New Zealand | 7.277 | 12.84 |
| Austria | 7.268 | 4.44 |
The 10 happiest countries in the world are less stringent compared to the rest of the world. The average relative stringency of the 10 happiest countries is -6.05.
The Netherlands, New Zealand and Austria are the only countries that score positively on relative stringency and are in the top 10 happiest countries.
This suggests that a country’s happiness is higher when the COVID-19 response measurements are less stringent.
Additionally, the 4 happiest countries in the world are less stringent than 88% of countries worldwide. Out of the 141 countries included in our stringency analysis:
- Finland is ranked 124th
- Denmark is ranked 117th
- Switzerland is ranked 121th
- Iceland is ranked 129th
The top 10 happiest countries are less stringent than 75% of the world.
As part of the World Happiness Report 2020, the authors focused on the difference between 2020 and pre-pandemic years. The authors of the report noted that COVID-19 didn’t have a significant impact on a country’s happiness rating.
No significant change in happiness was found. The change from 2017-2019 to 2020 varied among countries, but not enough to change rankings in any significant fashion materially. The same countries remain at the top.
World Happiness Report 2020
However, the change between 2017-2019 happiness scores and those of 2020 is slightly correlated to a country’s relative stringency score according to our analysis.
This observation is supported by another data study published by the Global Labor Organization (GLO). The authors of this study found that the more stringent the stay-at-home regulations are in a country, the greater the negative effect on that country’s happiness levels.
This study uses the Gross National Happiness Index (GNH), which is a real-time measure of well-being (happiness) derived from Twitter. It strongly implies that a higher stringency is directly related to reduced happiness levels.
A lenient COVID-19 response may actually have a positive effect on a country’s happiness.
What’s the exact impact of COVID-19 on happiness?
Above all, it’s clear that determining the impact that COVID-19 has on well-being levels is not straightforward. In fact, it’s very complex and finding a causal relationship is practically impossible. A lot of studies around the world have found interesting correlations using different methods:
Well-Being: Evidence from Singapore
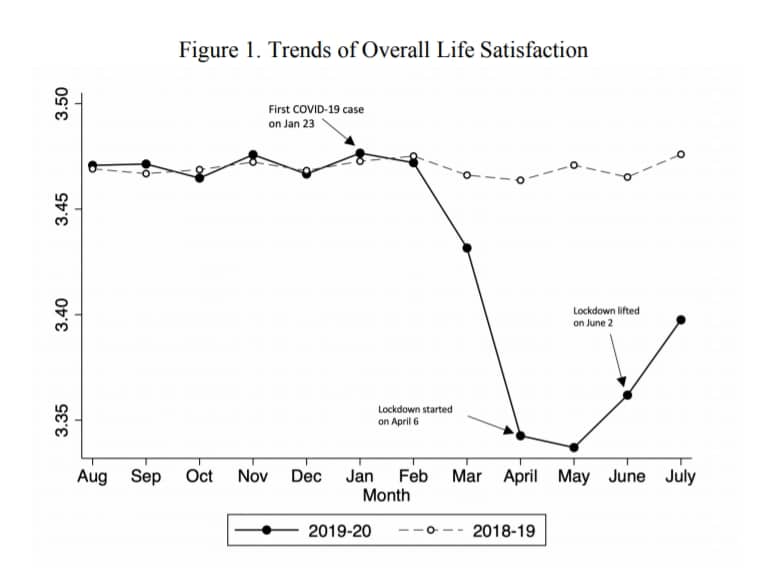
- This Japanese study found a positive effect of COVID-19 on happiness, due to work-from-home regulations and a resulting increase in daily step-count.
- This study compared happiness levels just before and during the peak of the outbreak in China, and found a 74% drop in emotional well-being.
These are just some examples, but they highlight how broad the spectrum of results can be.
While a lot of studies determine that lockdowns have a negative effect on our emotions, others find that lockdowns resulted in (indirect) improvements in mental health. An often-quoted example is that more people picked up outdoor walking as a hobby. For example, the United States experienced a 30% to 50% increase in traffic to state parks, which was arguably caused by the increase of people looking for outdoor walking areas. In turn, this healthy habit has indirectly had a positive effect on our mental well-being.
In the end, it seems to depend on too many factors to give a conclusive answer.
Conclusion
The COVID-19 pandemic has a staggering impact on the way we lead our lives. By combining the recent World Happiness Report data with the Oxford University’s Stringency Index, we’ve analyzed how the response of a country compares to the happiness levels of its citizens.
There is no strong correlation between stringency and happiness. And even though it’s impossible to find a causal relationship between a country’s stringency and happiness, it’s revealing to see the data on how some countries have fared during the pandemic. The data reveals a lot about how countries like New Zealand, Finland, Belarus and the United States have responded to the virus.